Good day!
Is there a way to directly access the .csv files mentioned in chapter 4.1.1. of Sen4CAP_DDF_V1.2_CropType ? I am interested in plotting the NDVI values for individual parcels, therefore I need the object feature statistics with valid NewID fields for each parcel.
In chapter 4.1 such .csv tables are described, but I cannot find them in the output products of L4A.
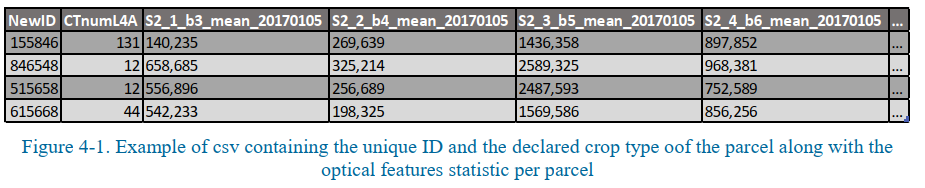
Where could I find, for example, a table that is shown in Figure 4-1?
Hello Harijs,
For now, if you use the web interface to launch a crop type, these intermediate files are erased and are not part of the outputs. In the outputs, you get two tables with the results of the features extraction by parcel (data_calib_final.csv and data_valid_final.csv) but without the NewID of the parcel, only the crop type (TARGET = CTnumL4A), and only for the classified parcels. We are in fact right now working on it to improve the outputs of this L4A crop type processor, and that’s one of the improvements that we are integrating. So it should be available in a next version of the system (and there will be, as always, easy update scripts if you have already installed the system). It is also part of the one year extension of the Sen4CAP project (which is running), to create an easy access to all the features and markers produced by the system, calculated by parcel, so there will be improvements in this matter.
For now, one trick is to launch the crop type command through the command prompt and it will keep these intermediate files in a dedicated “features” folder. I am not sure anymore if you installed the system on your machine or if you use a test machine that we provide in the framework of the project (in this last case, we don’t give access to the command prompt)? If it is installed on your machine, you can retrieve the crop type command from the web interface and run it through the command prompt. Please find an example of such a command:
crop-type-wrapper.py -s 22 --season-start 2019-03-01 --season-end 2019-08-31 --working-path /mnt/archive/temp/l4a/ --out-path /mnt/archive/temp/l4a/ --tiles 33VVC --lc 1234 --min-s2-pix 3 --min-s1-pix 1 --best-s2-pix 10 --pa-min 30 --pa-train-h 4000 --pa-train-l 1100 --sample-ratio-h 0.25 --sample-ratio-l 0.75 --smote-target 1000 --smote-k 5 --num-trees 300 --min-node-size 10
You should of course adapt the parameters and among them the site id (that you can find in the site table of the system database) and corresponding tiles.
Philippe
1 Like
Thank you for the reply, Philippe! We have installed the system on our own server, so we will try to access the data through the command prompt. Will let you know how it goes.
Also - happy to hear you are still improving on this already very robust system, we are very eager to see what you come up with. 
Update: this solution works perfectly - I can now access the .csv files with feature statistics within the temp folder. Thank you very much!
However, at this point I cannot find the actual product that was generated (the geometry files). It is not located at the usual location of
\archive\sitename\s4c_l4a
This is the command we used:
crop-type-wrapper.py -s 4 --season-start 2019-04-15 --season-end 2019-09-30 --working-path /mnt/archive/temp/l4a/ --out-path /mnt/archive/temp/l4a/ --tiles 34VEJ --lc 1234 --min-s2-pix 3 --min-s1-pix 1 --best-s2-pix 10 --pa-min 30 --pa-train-h 4000 --pa-train-l 1100 --sample-ratio-h 0.25 --sample-ratio-l 0.75 --smote-target 1000 --smote-k 5 --num-trees 300 --min-node-size 10
Any suggestion as to where one could find it? Also - are the NewIDs different with each iteration or are they fixed for the site is same geometry and LUT is used?
Indeed, the shp output is not generated with this command. But the predictions are all contained in the file: Predict_classif_Ranger_*.csv. For the NewIDs, if you did not upload a new version of the parcels in the meanwhile, the parcels have the same NewIDs. So:
-
If you have already produced such a shp via the web interface (an older version L4A crop type with the same parcels), you can erase the columns which concern the predictions in this old shp and join the results of this new csv file.
-
Or, in the system database (that you can access from the command prompt with: sudo -u postgres psql sen4cap), the table that contains the general information concerning the parcels (without the prediction) is the following: decl_{site_name}_ {year}. You can check it in the system database and even exported in shp using the following command:
ogr2ogr -f “ESRI Shapefile” -lco ENCODING=UTF-8 /{path}/parcels.shp PG:“host=localhost user=admin dbname=sen4cap password=sen2agri port=5432” -sql “SELECT * from decl_{site_name}_{year}”. And then, make the join with the csv file.
1 Like